J'utiliserais deux collections de lignes pour cela :
import numpy as np
import matplotlib.pyplot as plt
from matplotlib.collections import LineCollection

x, y = np.meshgrid(np.linspace(0,1, 11), np.linspace(0, 0.6, 7))

plt.scatter(x, y)

segs1 = np.stack((x,y), axis=2)
segs2 = segs1.transpose(1,0,2)
plt.gca().add_collection(LineCollection(segs1))
plt.gca().add_collection(LineCollection(segs2))
plt.show()
Voir également Comment tracer à l'aide de la grille déformée de matplotlib (python) colah ?
Parce que si la grille n'est pas déformée, il serait plus efficace de dessiner une seule collection de lignes, comme
import numpy as np
import matplotlib.pyplot as plt
from matplotlib.collections import LineCollection

x, y = np.meshgrid(np.linspace(0,1, 11), np.linspace(0, 0.6, 7))

segs1 = np.stack((x[:,[0,-1]],y[:,[0,-1]]), axis=2)
segs2 = np.stack((x[[0,-1],:].T,y[[0,-1],:].T), axis=2)

plt.gca().add_collection(LineCollection(np.concatenate((segs1, segs2))))
plt.autoscale()
plt.show()
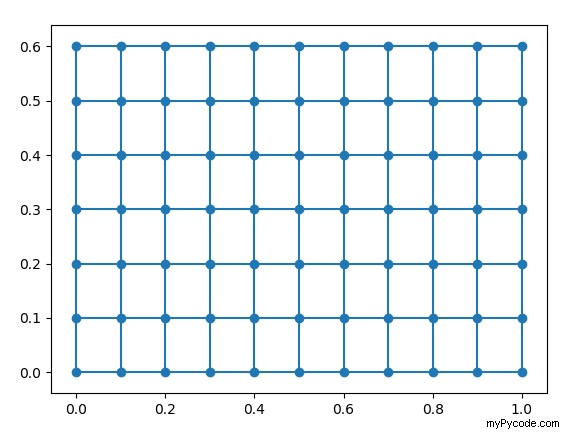
Vous pouvez np.transpose les points que vous avez déjà, en utilisant une ligne plot() plutôt que scatter() .
import numpy as np
import matplotlib.pyplot as plt

x, y = np.meshgrid(np.linspace(0,1, 11), np.linspace(0, 0.6, 7))

plt.plot(x, y) # use plot, not scatter
plt.plot(np.transpose(x), np.transpose(y)) # add this here
plt.show()
Vous pouvez bien sûr le faire colorier en noir avec c='k' 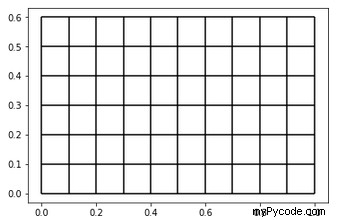
IIUC, vlines et hlines ferait :
plt.vlines(np.linspace(0,1,11), 0, 0.6)
plt.hlines(np.linspace(0,0.6,7), 0, 1)
Si vous avez déjà le maillage x,y :
plt.vlines(x[0], *y[[0,-1],0])
plt.hlines(y[:,0], *x[0, [0,-1]])
Sortie :