Essayez ceci :
import plotly.graph_objects as go
from plotly.subplots import make_subplots

trace1 = go.Bar(
    x=df[cat],
    y=df[num],
    name=num,
    marker=dict(
        color='rgb(34,163,192)'
               )
)
trace2 = go.Scatter(
    x=df[cat],
    y=df['cumulative_perc'],
    name='Cumulative Percentage',
    yaxis='y2'

)

fig = make_subplots(specs=[[{"secondary_y": True}]])
fig.add_trace(trace1)
fig.add_trace(trace2,secondary_y=True)
fig['layout'].update(height = 600, width = 800, title = title,xaxis=dict(
      tickangle=-90
    ))
iplot(fig)
Donne, 
Vous pouvez faire quelque chose comme ça :
fig = make_subplots(rows=1, cols=2)
fig.add_trace(trace1, row=1, col=1)
fig.add_trace(trace2, row=1, col=2)

fig.update_layout(xaxis=dict(tickangle=90))
fig.show()
Ce qui produira le graphique suivant :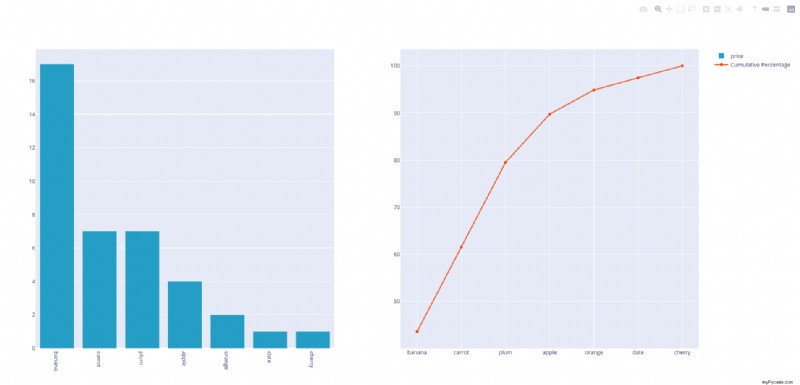
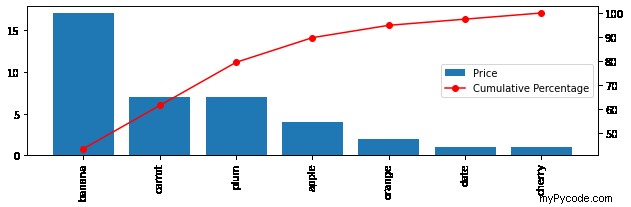
- La fonction matplotlib twinx() peut instancier un second axe partageant le même axe x.
plt.xticks(rotation=90)pour faire pivoter l'étiquette de l'axe des x.z-orderpour spécifier l'ordre de dessin.
import pandas as pd
import matplotlib.pyplot as plt

df = pd.DataFrame({
            'price': [ 4.0, 17.0, 7.0, 7.0, 2.0, 1.0, 1.0],
            'item': ['apple', 'banana', 'carrot', 'plum',
                    'orange', 'date', 'cherry']})

num = 'price'
cat = 'item'

df = df.sort_values(num, ascending=False)
df['cumulative_sum'] = df[num].cumsum()
df['cumulative_perc'] = 100*df['cumulative_sum']/df[num].sum()

df['demarcation'] = 80

title = 'Pareto Chart'

plt.figure(figsize=(9, 3))

axes1 = plt.subplot()
b = axes1.bar(df[cat], df[num], label='Price')

plt.xticks(rotation=90)

# use twinx() function to create the second axis object “ax2”
axes2 = axes1.twinx()

p = axes2.plot(df[cat], df['cumulative_perc'], c='r', marker='o', zorder=5, label='Cumulative Percentage')

axes1.legend(handles=(b, p[0]), loc='center right')

plt.tight_layout()
plt.show()