Le code le plus simple pour obtenir ce résultat est le suivant :
import seaborn as sns
import matplotlib.pyplot as plt
sns.set()
tips=sns.load_dataset("tips")
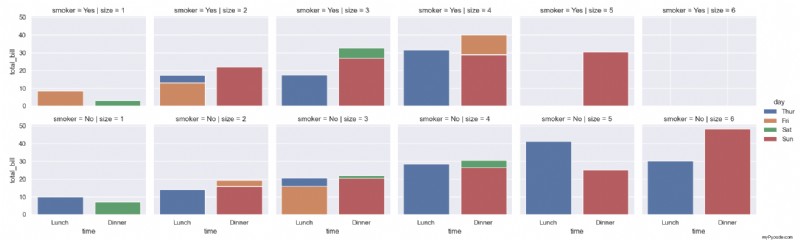
g = sns.FacetGrid(tips, col = 'size', row = 'smoker', hue = 'day')
g = (g.map(sns.barplot, 'time', 'total_bill', ci = None).add_legend())
plt.show()
ce qui donne ce résultat :